Meet Madison Dearly
We offer top notch bookkeeping for brand and web designers who think big. Most importantly, we're here to make your numbers accessible and understandable. Curious about working with us? Come take a peek!
5 Ways Better Bookkeeping Can SAVE You Money
DOWNLOAD NOW
How (and Why) to Read a P&L Report
April 18, 2023
Spend any time learning about business finances, and you’ll hear a LOT about the P&L. But what even is a P&L? Why do you need one? And how on earth do you read it?
P&L stands for Profit & Loss. And that’s what this report shows — the financial gains and losses in your business. That’s crucial information! So if you want to make sure you know as much as possible about the money in your business, get comfortable with the P&L.
I’ll walk you through a P&L step-by-step so you know exactly where to get one, how to read it, and what to do with the information. Plus, I’ll cover the Cash Summary report — which I think is even more important (gasp!) than the P&L!
Ready to dive in? Grab your coffee (or a glass of wine — no judgment!) and your latest P&L so you can follow along. Let’s go!
Reading a P&L
Before we get started, let’s clear something up. An Income Statement is the same thing as a P&L. So if your accounting software gives you an Income Statement, no worries. You’ll read it exactly like a P&L.


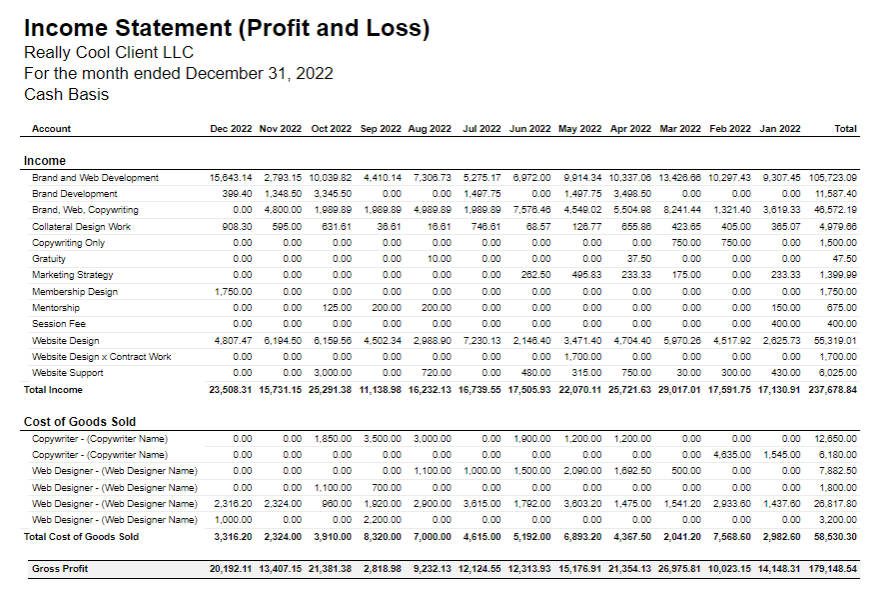
OK, now that we’ve sorted that out, let’s talk about the info in a P&L:
- Revenue/Income
- Cost of Goods Sold
- Operating Expenses/Overhead Expenses
- Profit/Net Income
All the numbers in a P&L will fall into one of those categories. Now, let’s look a little deeper at each of those sections.
Revenue/Income

It’s important to make sure your revenue numbers are broken out by product or service. That way, you can tell exactly how much each of your offers brought in during the month. And once you have that information, you can decide what (if anything) you want to change. For example, you might want to put more resources into marketing your most lucrative offer. Or you might want to consider dropping a service that consistently underperforms.
It’s also important to look at how your revenue changes month to month. If there’s a month when your income was especially high or low, you need to figure out the reason! You can also compare revenue by quarter to see which parts of the year are better or worse for your business. And you can zoom out even more to see how your revenue changes year over year.
Cost of Goods Sold

Next, we’ll take a look at the first “loss” category — Cost of Goods Sold (COGS). That’s everything that you had to spend to create the offers/products/services that you sold to your clients. That can include payments to contractors and/or the cost of raw materials.
Want to know how much Gross Profit you made in a month? Just take your total revenue that month and subtract the Cost of Goods Sold.
Bonus tip: If you want to know your Gross Profit Margin (which is a percentage), divide your Gross Profit by your revenue, and then multiply that answer by 100. That’s your Gross Profit Margin.
Operating Expenses

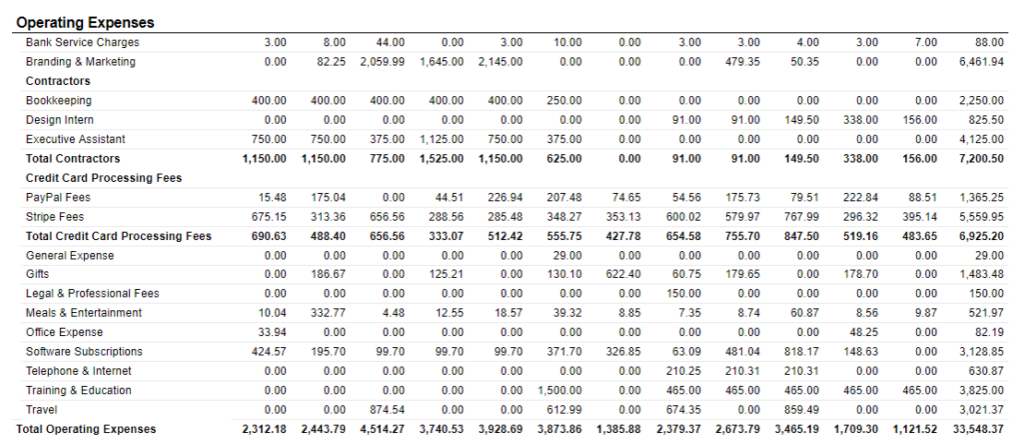
The COGS category doesn’t cover all the money you spend on your business. That’s why we have the next category: Operating Expenses.
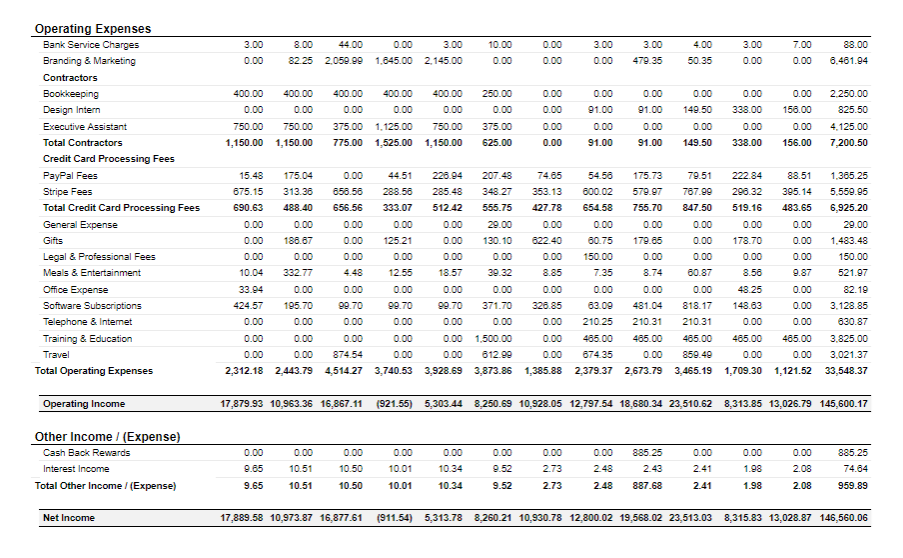
This is where you’ll list things like software subscriptions, payment processing fees, team member salaries, office supplies, legal fees, and educational courses. These are all expenses that you need to pay whether you have revenue or not (the lights gotta stay on!), unlike COGS which are directly related to the revenue you bring in.
Net Profit/Net Income

Now, we can look at the most important section of the P&L: Net Profit! (In the screenshot above, it’s broken down by month, with a total column to the far right.) Earlier, we calculated Gross Profit, which factors in COGS and revenue. Net Profit takes that one step further by including ALL the expenses in your business: COGS and operating expenses.
To find your Net Profit, take the Gross Profit you calculated earlier and subtract your operating expenses. The result is the amount of money you actually have left over after covering all the expenses that month!
Bonus tip: As with Gross Profit, you can also calculate your Net Profit Margin by dividing the Net Profit by your revenue and multiplying that number by 100.
Cash Summary report
A P&L is great — it gives you so much insight into how your business is doing financially. You can see which offers are making you the most income, which services or contractors are costing the most money, and how profitable your business is overall.
But I’ll let you in on a secret — there’s an even better report out there! And it’s the Cash Summary. I know, it might sound like a hot take, but I stand by it.
The Cash Summary shows you everything that’s on a P&L, plus even more crucial information! This report shows you the profit/loss each month (although it tends to use the terms “surplus” and “deficit”), but it also includes other cash activity, like:
- Credit card payments
- Owner’s draws (how you pay yourself if your business is an LLC)
- Estimated tax payments
- Cash withdrawals for big purchases, like real estate
- Dipping into your cash savings to cover time off from your business (like maternity leave)
Keep in mind that each of these details won’t ever show up on your Profit & Loss report, because of a little thing we accountants know and love called the Generally Accepted Accounting Principles (GAAP). With even more information included on this specific report, you can calculate the Net Cash Flow each month — that means you’ll know exactly how much money went in and out of your business. It’s like the next level of info beyond the Net Profit at the bottom of your P&L.
Figure out what’s really going on in your business
Whew — we made it through the P&L and the Cash Summary! How do you feel? Hopefully, you feel like you know a lot more about the financial state of your business.
These reports are so critical because they give you the data you need to run your business well. You can see which offers are bringing in the most revenue, or where you’ve let your spending run a little wild. And you can truly determine if your business is profitable.
But before you can pull a P&L or a Cash Summary, what do you need? You guessed it — up-to-date books. Yep, it all comes back to bookkeeping. And if you can think of a million things you’d rather do than enter your transactions in a spreadsheet or accounting program, that’s what I’m here for!
Here’s what you get when you work with me:
- Transaction management and categorization (we’ll take the tedious stuff OFF your plate!) by the 15th of every month
- A financial summary delivered each month, so you know where your money came from and went!
- Quarterly custom Loom videos to dive deeper into your financial reports, so we can make sure you feel completely confident in knowing your numbers.
- Access to our entire library of digital products!
- Quarterly visual reports, complete with pie charts, bar graphs, and high-level helpful info about your monthly bookkeeping. This makes it easy to see your numbers in a way that works for your brain — and that isn’t a total snooze.
- Voxer access to me, where you can ask clarifying questions about expenses, get help with your reports, and more!
Interested in that kind of support for YOUR creative online business?

Leave a Reply Cancel reply
Join The Monthly Book(keeping) Club
If you’re doing your bookkeeping yourself... AND PUTTING IT OFF for months at a time
JOIN THE CLUB
A done-with-you monthly bookkeeping membership for the online business owner who wants to learn how to do their business bookkeeping and actually get it done each month.
SITE CREDIT
Terms and Conditions
Privacy Policy
Want my best business finance tips delivered straight to your inbox? Join my email list here!
SUBSCRIBE
Madison Dearly Financial is the only comprehensive accounting firm exclusively serving creative small businesses.
Bookkeeping & Tax Services for CREATIVE PROFESSIONALS
PHOTOGRAPHY
Madison Dearly Financial is an independent firm and is not affiliated with, endorsed by, or officially associated with any accounting software platforms such as Xero, QuickBooks, or Gusto. All trademarks belong to their respective owners.
Pricing Note: Listed prices reflect base rates. Final pricing may vary based on the scope, complexity, and timeline of the project. Payment plans may be available upon approval.
Timeline Note: Estimated timelines are based on receiving timely client responses and smooth implementation. Projects with custom needs or delays may require additional time.
Content Disclaimer: Our blog content is for educational purposes only and does not replace professional financial, legal, or tax advice. We aim to keep information current and helpful—please consult a licensed expert before making decisions based on this content.
Paragraph
Paragraph
Home
About
Work With Us
Template Shop
Membership
Blog
Resources
Contact
Go ahead—
check us out!
We're an open book.
[…] not talking about your revenue, expenses, or profits (find that discussion here) — I’m talking about your literal financial setup. That means your bank […]
[…] Pull your latest P&L (that link will help you if you don’t know what a P&L is), and let’s get […]
[…] pull your latest P&L, grab a calculator, and get cozy with your favorite drink — let’s figure this […]
[…] I love Dubsado because it has so many useful bookkeeping features on top of all the CRM functionality. Specifically, Dubsado’s reports can make it so much easier to read — and understand — your P&L! […]
[…] get comfy, pull your last P&L (or even better, a Cash Summary), and settle in. Let’s talk about the questions you should ask yourself before hiring a new team […]